
Editorial
"THE VIRTUOUS BOOK"
Visualizing Violence Using the Beauty of Data & Design
PROJECT OVERVIEW
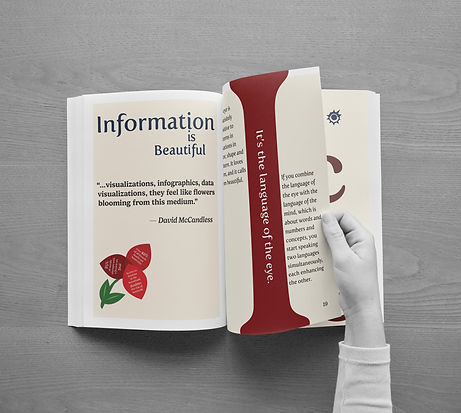
“Visualizing Violence” is an extensive 52-page typography-driven book project that explores the intersection of visual design and data representation. The book merges the visionary insights of Bruno Munari’s Design as Art with the transformative concepts from David McCandless’s TED Talk, The Beauty of Data Visualization. By presenting statistical data about gun violence in the United States, the project aims to foster awareness and provoke meaningful discussion.
DESIGN CONCEPT
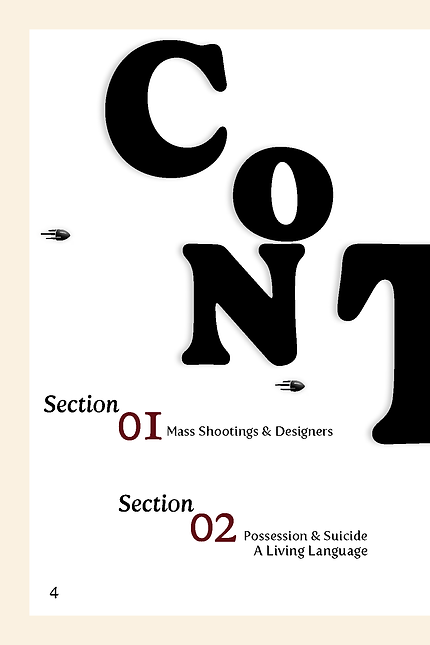
The concept behind Visualizing Violence is to create a compelling visual narrative that merges typographic design with infographic-style layouts. Through this approach, the book conveys statistical data on gun violence in a way that captivates the reader and inspires reflection. The contrast between the beauty of typography and the harshness of the subject matter underscores the urgency of the issue, while maintaining a design that is both informative and aesthetically engaging.


RESEARCH & AESTHETICS
Extensive research went into gathering accurate and impactful statistical data to ensure the visualizations within the book would be both truthful and thought-provoking. The process involved curating a wide range of reliable data sources, which were distilled into clear, visualized formats. Each page was designed to balance the intensity of the topic with a visually engaging layout, ensuring that the design did not detract from the gravity of the subject.
Infographic elements were interwoven with the text to illustrate the staggering realities of gun violence in the United States. Unique material treatments such as juxtaposing typography with charts and statistical overlays were employed to enhance the visual storytelling. A variety of typographical styles were used to guide the reader through the narrative, transforming data into a cohesive and immersive visual experience.


